File:Ice-Shelf Melting.jpg
Original file (1,659 × 1,452 pixels, file size: 350 KB, MIME type: image/jpeg)
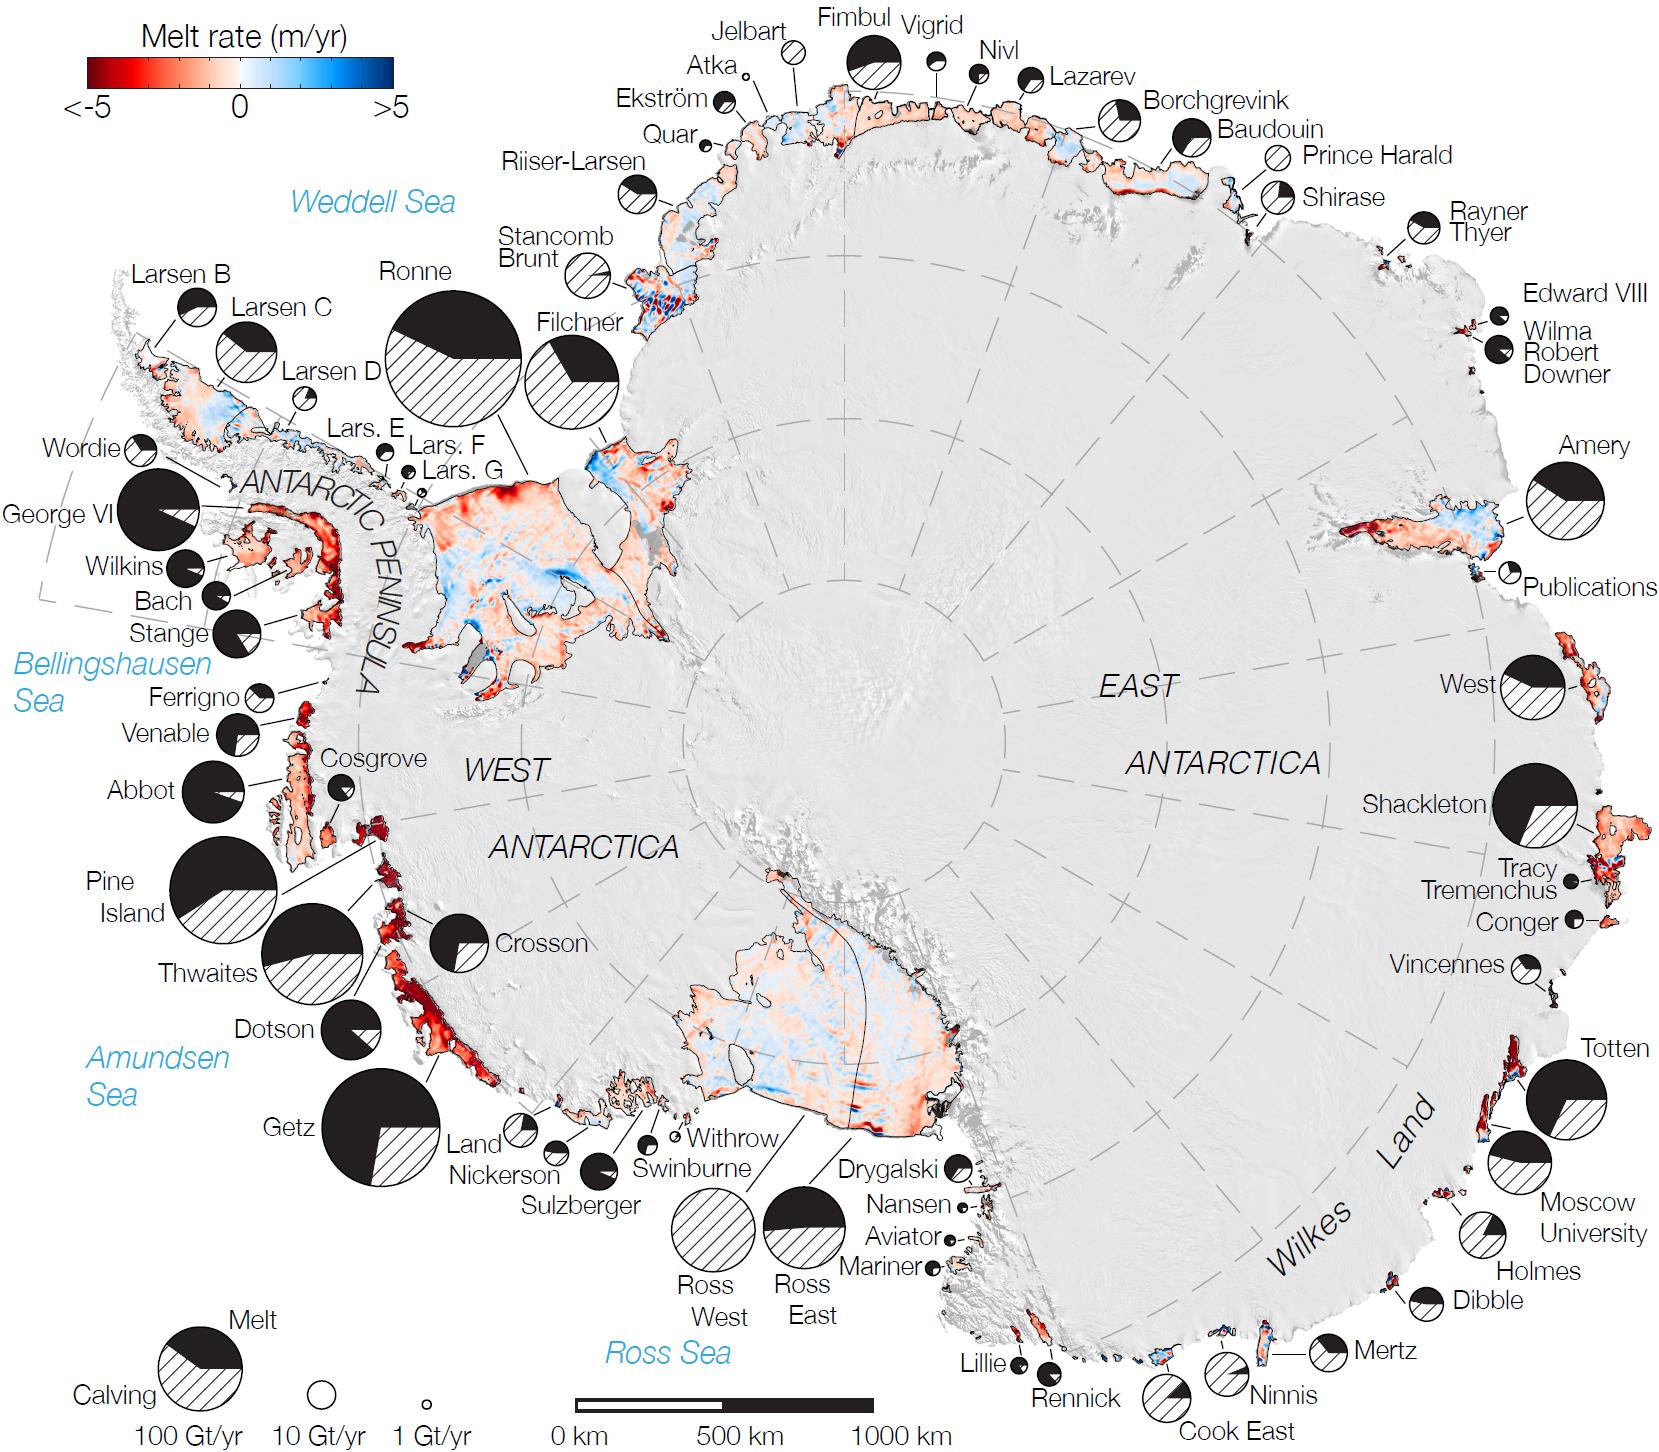
Rates of basal melt of Antarctic ice shelves (melting of the shelves from underneath) overlaid on a 2009 mosaic of Antarctica created from data from NASA's Moderate Resolution Imaging Spectroradiometer (MODIS) instrument aboard NASA's Terra and Aqua spacecraft. Red shades denote melt rates of less than 5 meters (16.4 feet) per year (freezing conditions), while blue shades represent melt rates of greater than 5 meters (16.4 feet) per year (melting conditions). The perimeters of the ice shelves in 2007-2008, excluding ice rises and ice islands, are shown by thin black lines. Each circular graph is proportional in area to the total ice mass loss measured from each ice shelf, in gigatons per year, with the proportion of ice lost due to the calving of icebergs denoted by hatched lines and the proportion due to basal melting denoted in black.
Source: NASA / JPL
File history
Click on a date/time to view the file as it appeared at that time.
| Date/Time | Thumbnail | Dimensions | User | Comment | |
|---|---|---|---|---|---|
| current | 22:50, 10 April 2018 | | 1,659 × 1,452 (350 KB) | Westarctica (talk | contribs) |
You cannot overwrite this file.
File usage
The following page uses this file: