Difference between revisions of "File:West Antarctic Warming Graphic.png"
Westarctica (talk | contribs) |
(No difference)
|
Latest revision as of 06:08, 9 April 2018
Researchers at Ohio State University and their colleagues have discovered that the central region of the West Antarctic Ice Sheet (WAIS) is experiencing twice as much warming as previously thought. Their analysis of the temperature record from Byrd Station (indicated by a star) sheds some light on temperature changes over a broad portion of the WAIS.
This site provides the only long-term temperature observations in the region, far away from the permanent research stations with long-term temperature records (indicated by black circles) that are scattered around the continent -- making a case, the researchers say, for a more robust network of meteorological observations on the WAIS. On this map, the color intensity indicates areas around Antarctica that are likely experiencing comparable warming to Byrd Station.
Credit: Image by Julien Nicolas, courtesy of Ohio State University.
File history
Click on a date/time to view the file as it appeared at that time.
| Date/Time | Thumbnail | Dimensions | User | Comment | |
|---|---|---|---|---|---|
| current | 06:08, 9 April 2018 | 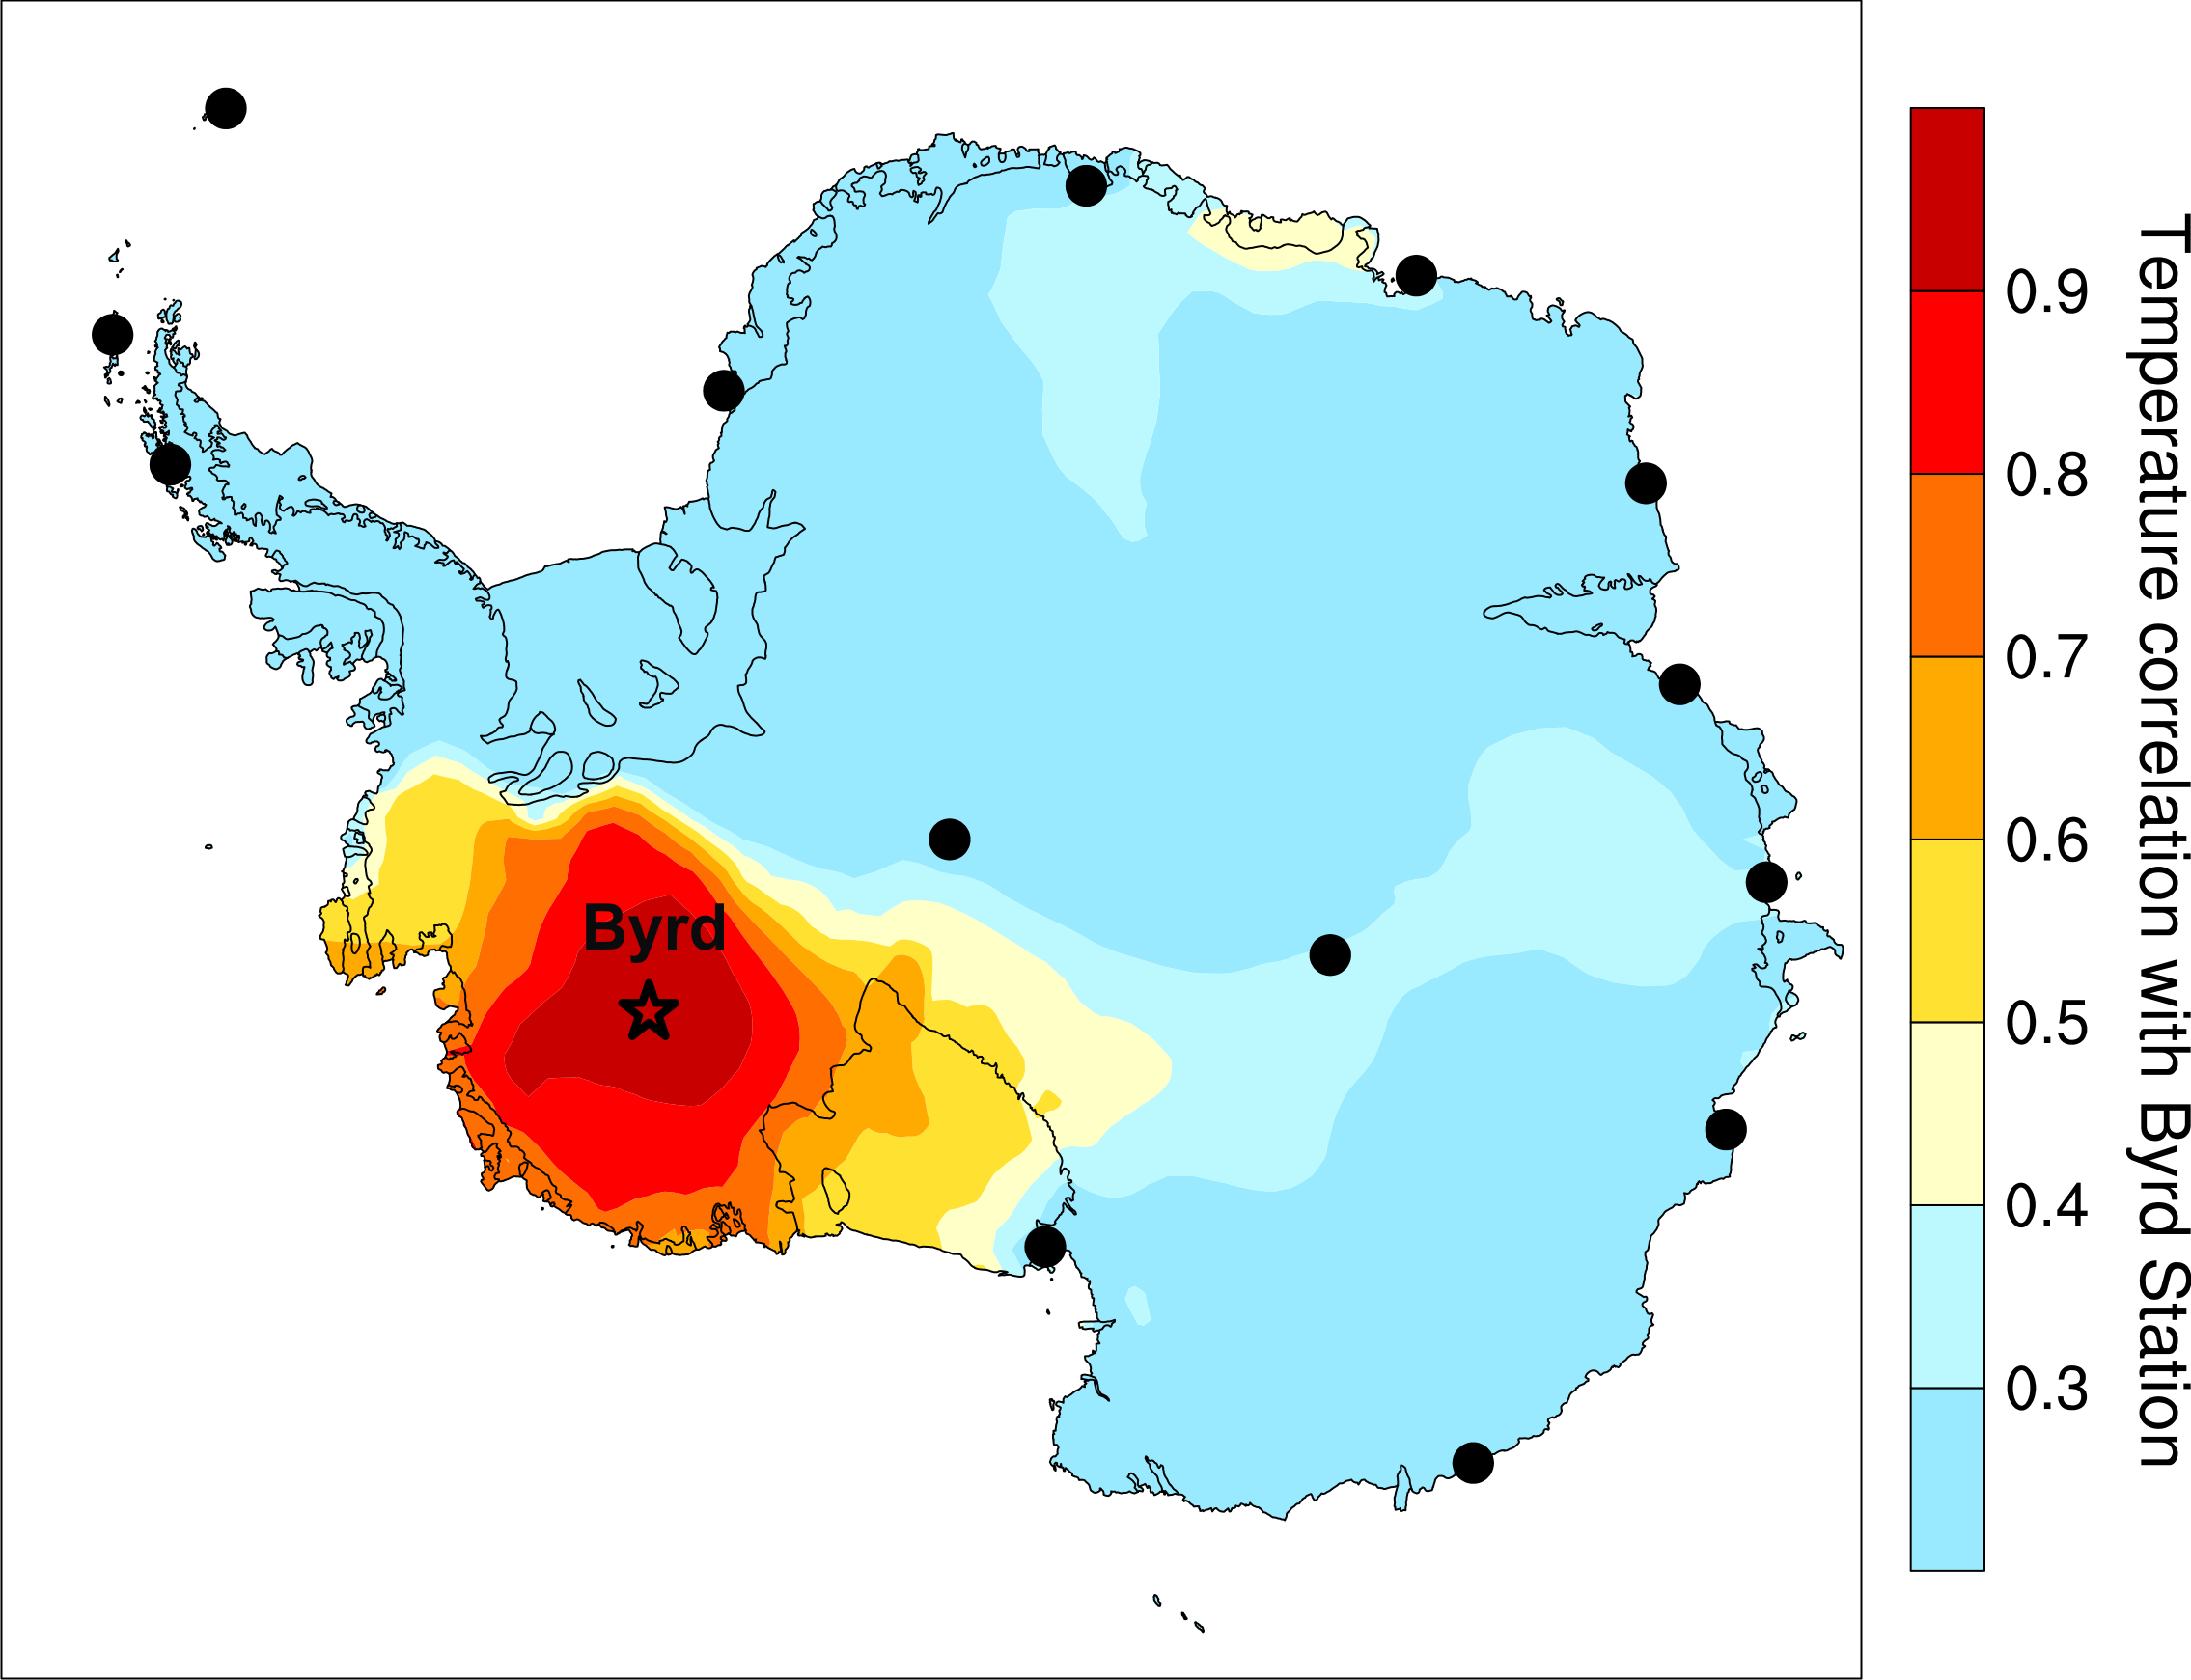 | 2,270 × 1,741 (525 KB) | Westarctica (talk | contribs) |
You cannot overwrite this file.
File usage
The following page uses this file: