File:Global-Temperature-Rise.jpg
Original file (967 × 853 pixels, file size: 123 KB, MIME type: image/jpeg)
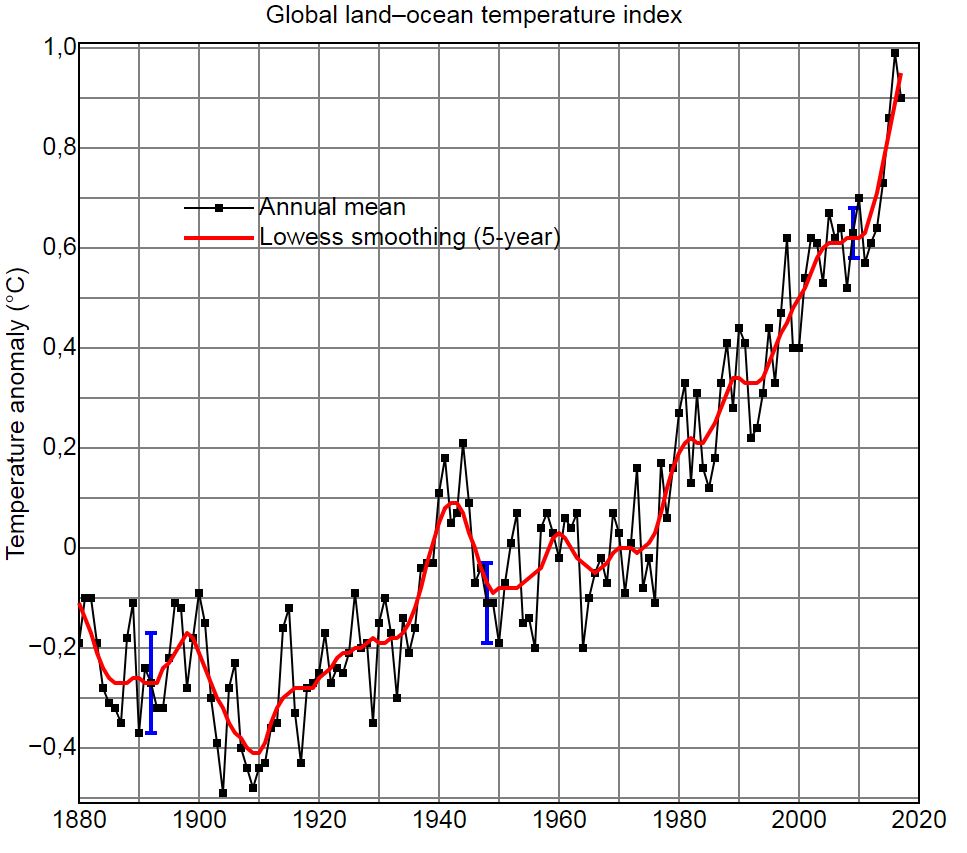
English: Land-ocean temperature index, 1880 to present, with base period 1951-1980. The solid black line is the global annual mean and the solid red line is the five-year lowess smooth, i.e. a nonparametric regression analysis that relies on a k-nearest-neighbor model. The function is evaluated using a fraction of data corresponding to a ten year window of data, giving an effective smoothing of approximately five years. The blue uncertainty bars (95% confidence limit) account only for incomplete spatial sampling. This is based upon Fig. 1A in Hansen et al. (2006) and Fig. 9a in Hansen et al. (2010). The graph shows an overall long-term warming trend.
Date 27 January 2017, 12:11 Source http://data.giss.nasa.gov/gistemp/graphs/ Author NASA Goddard Institute for Space Studies Other versions Derivative works of this file: Globalni teplotni odchylka cs.svg (czech) Derivative works of this file: Temperature Anomaly 1880-now NL.svg (dutch)
Source: Wikimedia Commons
File history
Click on a date/time to view the file as it appeared at that time.
| Date/Time | Thumbnail | Dimensions | User | Comment | |
|---|---|---|---|---|---|
| current | 16:32, 11 May 2018 | | 967 × 853 (123 KB) | Westarctica (talk | contribs) |
You cannot overwrite this file.
File usage
The following page uses this file: